DATA ANALYTICS PROJECT

Customer Behavior Analysis

Interactive customer analytics project using data cleaning, SQL analysis and Power BI visualization to understand purchasing behavior, category performance, customer segments, subscription status and sales trends.

Customer Behavior Analysis Power BI dashboard

Project Overview

This project analyzes customer purchasing behavior and sales performance through an interactive Power BI dashboard. Python and Jupyter Notebook were used for data cleaning and preprocessing, PostgreSQL and SQL were used for analytical querying, and Power BI was used to build the final interactive dashboard.

Power BI Python SQL PostgreSQL Jupyter Notebook Data Analytics Data Visualization

Key KPIs

334Customers
$58.82Avg Purchase
3.78Avg Review Rating
100%Shown Subscription

Dashboard Views

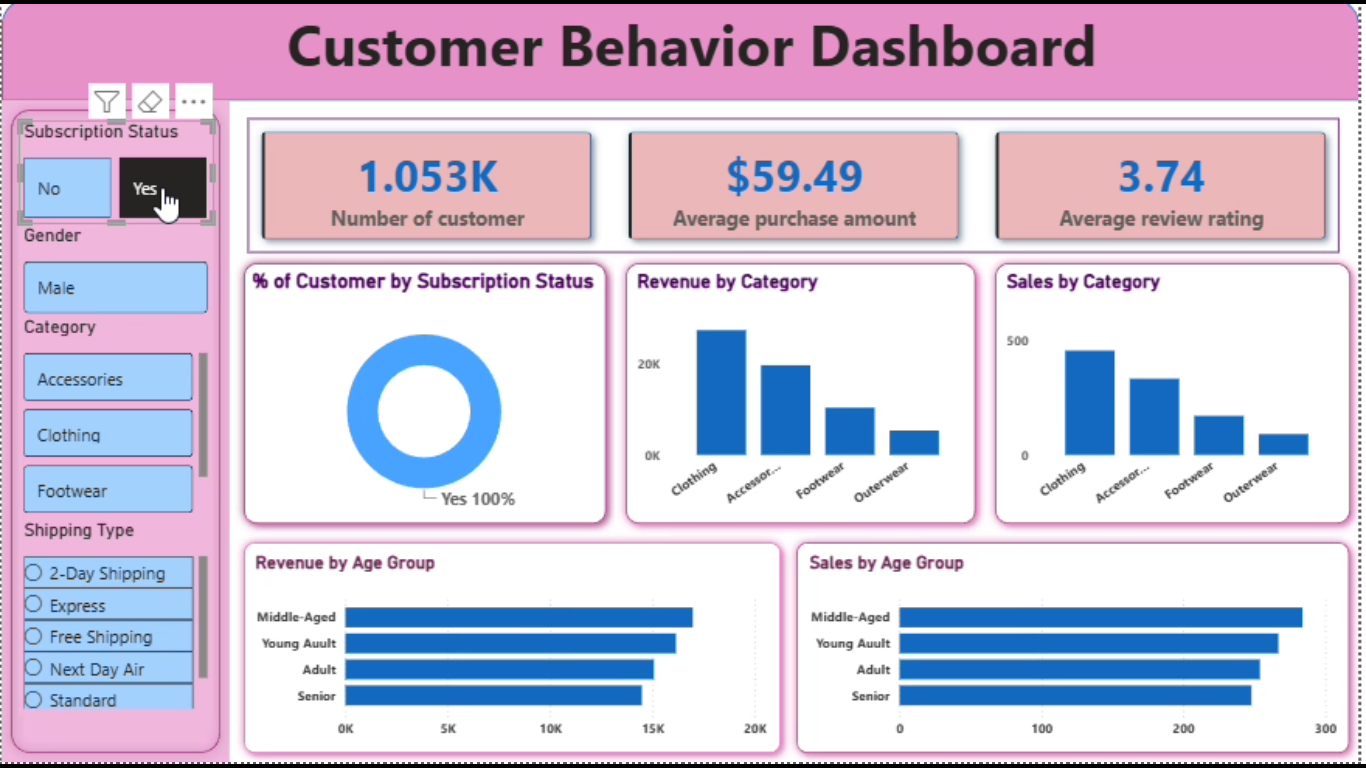
Customer Behavior Analysis main dashboard

01 — Customer & Sales Overview

Main dashboard showing customer count, average purchase amount, review rating, subscription status, revenue, sales, age-group performance and shipping filters.
Customer Behavior Analysis additional dashboard view

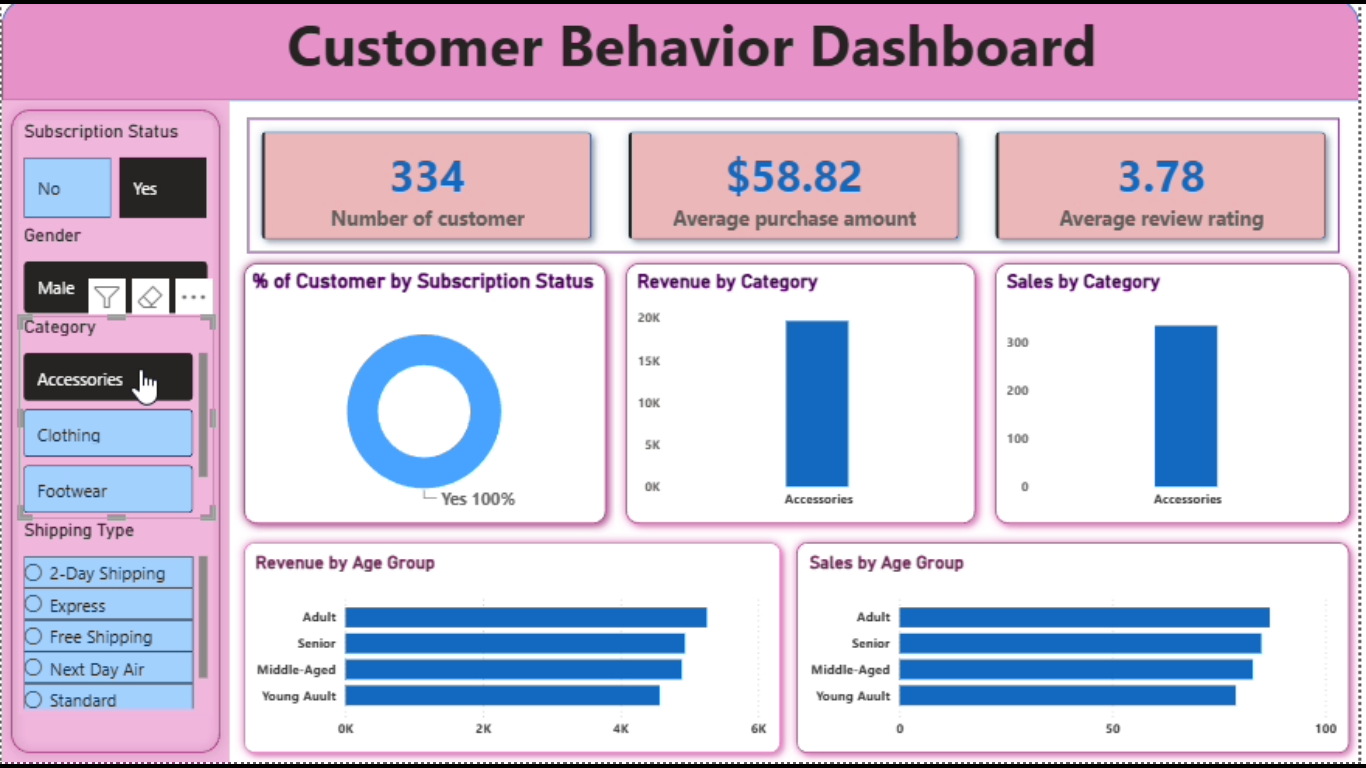
02 — Customer Behavior Analysis View

Additional dashboard view used to explore customer behavior and compare performance across categories and customer segments.
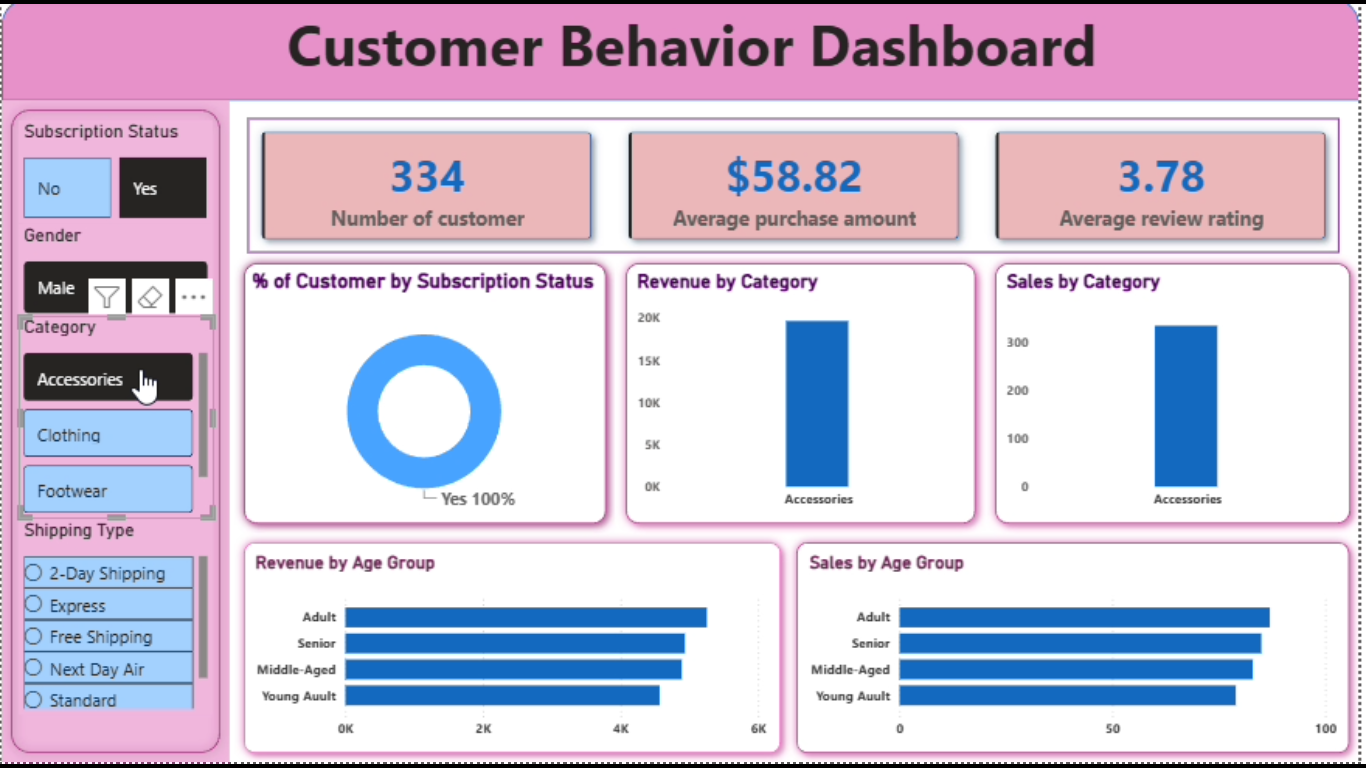
Interactive Filtering

Customer Behavior Analysis interactive filtering dashboard

Key Insights

  • Customer purchasing behavior can be compared across product categories.
  • Revenue and sales performance can be analyzed by category and age group.
  • Subscription status can be used to segment customers interactively.
  • Average purchase amount and review rating provide useful customer KPIs.
  • Interactive filters make it easier to investigate specific customer segments.
  • Department/category and demographic views support data-driven business decisions.

Future Scope

  • Add customer retention and repeat-purchase analysis.
  • Build customer segmentation using RFM analysis.
  • Add monthly and yearly sales trend analysis.
  • Create predictive customer churn or purchase-value models using Python.
  • Add drill-through pages for individual categories and customer segments.

Tools & Technologies

Python Jupyter Notebook PostgreSQL SQL Power BI Power Query DAX

Project Outcome

Built an interactive analytics solution that transforms customer-level data into understandable KPIs, visual trends and filterable business insights.

View GitHub ↗
← Back to Data Analytics Projects