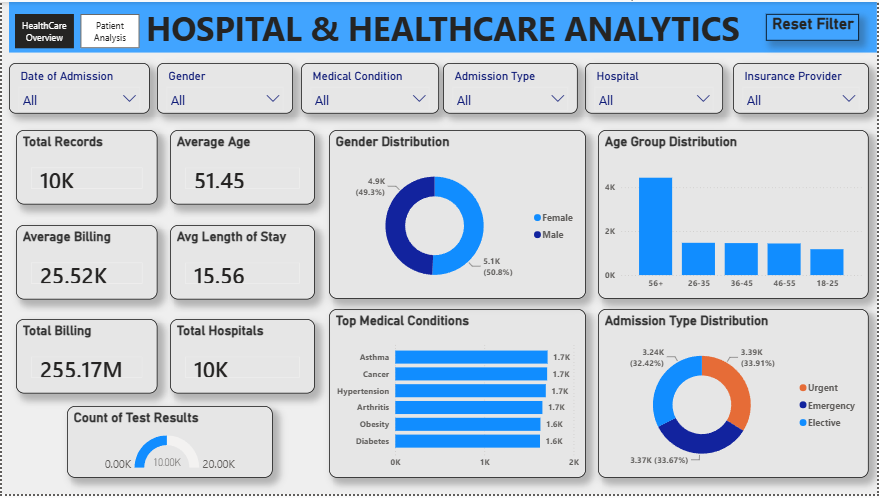
01 — Healthcare Overview
Overview page showing total records, average age, average billing, average length of stay, total billing, hospital count, gender distribution, age groups, top medical conditions, admission types and test-result analysis.
DATA ANALYTICS PROJECT
Interactive healthcare analytics project using Excel, Python, PostgreSQL, SQL and Power BI to analyze patient records, hospital activity, admissions, billing and healthcare patterns.
This project analyzes healthcare records to understand patient demographics, medical conditions, admission patterns, hospital activity, billing, insurance and length of stay. Excel was used for initial data inspection and preparation, Python and Jupyter Notebook for data cleaning and analysis, PostgreSQL and SQL for structured business analysis, and Power BI for the final interactive dashboard.
Overview page showing total records, average age, average billing, average length of stay, total billing, hospital count, gender distribution, age groups, top medical conditions, admission types and test-result analysis.
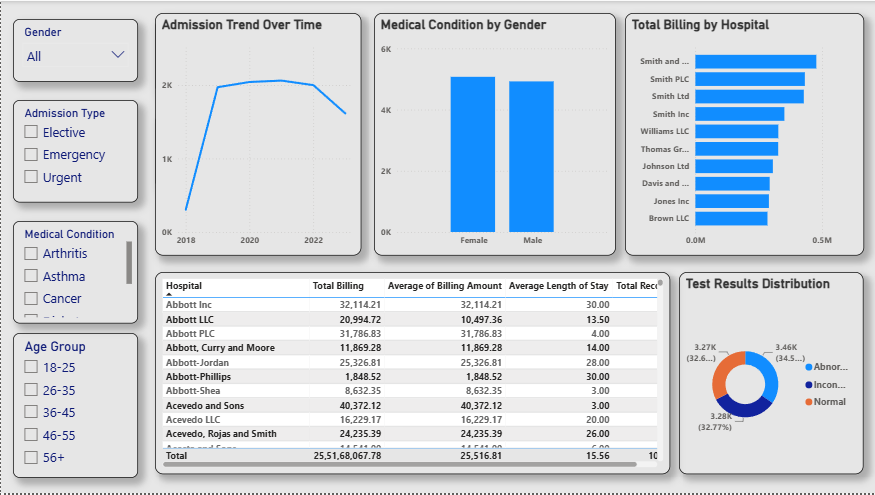
Analysis page covering admission trends over time, medical condition by gender, total billing by hospital, a hospital-level summary table and test-results distribution.
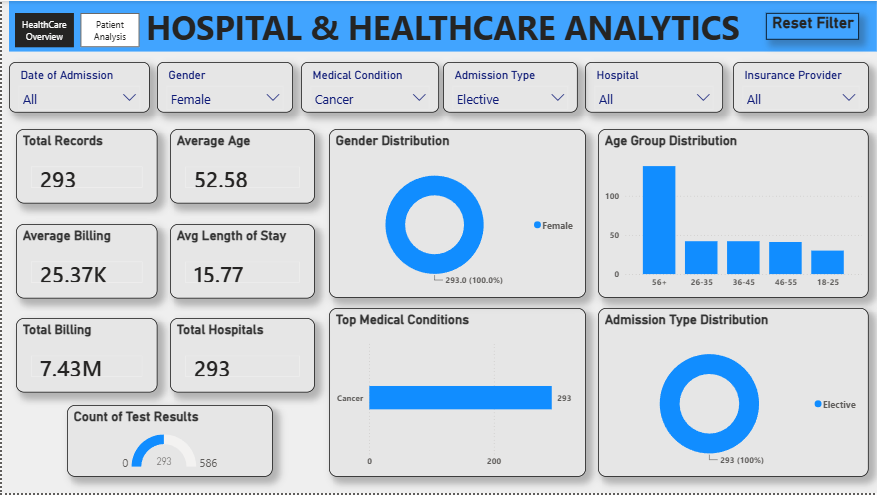
Demonstrates dynamic filtering using Gender, Medical Condition and Admission Type. In the shown example, selecting Female, Cancer and Elective updates the KPIs and visuals to the selected patient segment.
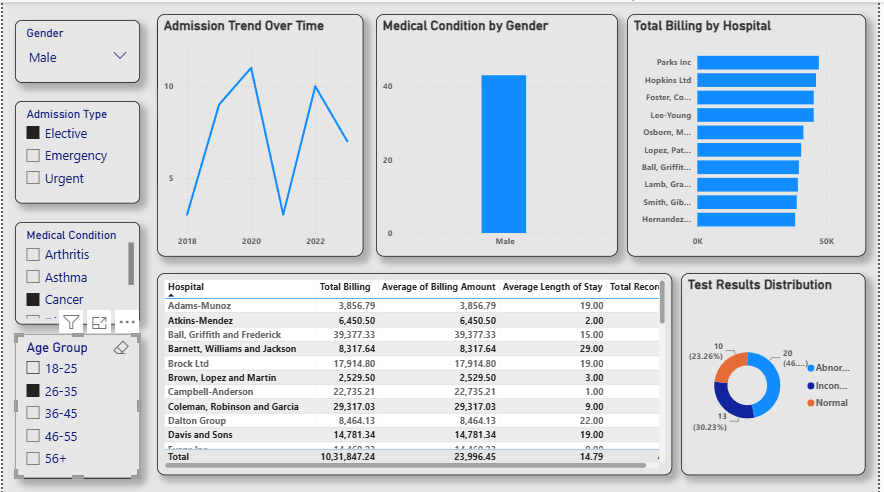
Demonstrates the second dashboard page responding to filters, with changes reflected in admission trends, medical-condition analysis, hospital billing, summary data and test-result distribution.
Built an interactive healthcare analytics solution that combines data preparation, SQL analysis and Power BI visualization to turn patient and hospital records into understandable KPIs, trends and filterable insights.
View GitHub ↗