DATA ANALYTICS PROJECT

HR Analytics Dashboard

Interactive Power BI dashboard analyzing employee workforce patterns and attrition to support HR decision-making and retention analysis.

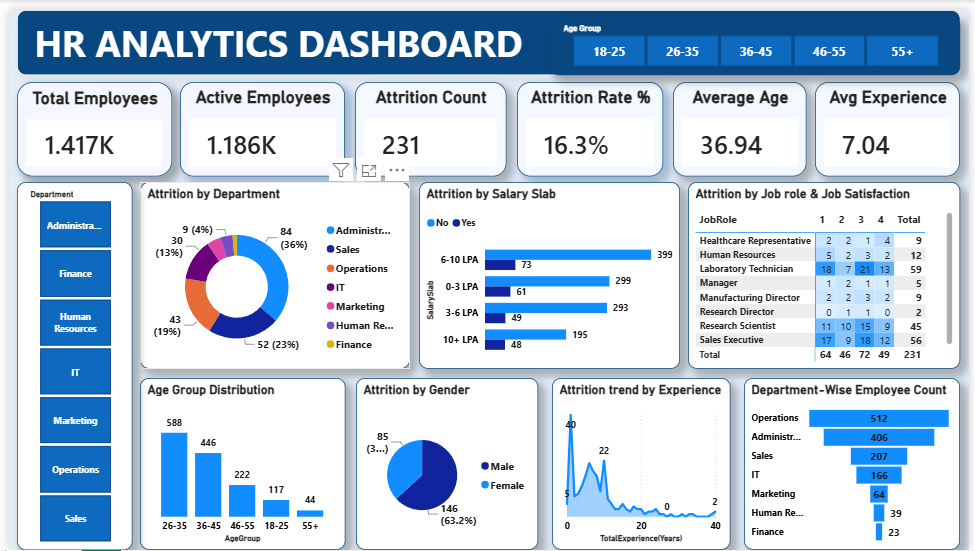
HR Analytics Dashboard main view

Project Overview

The HR Analytics Dashboard was developed in Microsoft Power BI to analyze employee workforce composition and attrition. The dashboard brings key HR metrics into a single interactive view and allows analysis across departments, salary slabs, job roles, satisfaction, age, gender and experience.

Power BIPower QueryDAXData AnalyticsData Visualization

Key KPIs

1.417KTotal Employees
1.186KActive Employees
231Attrition Count
16.3%Attrition Rate
36.94Average Age
7.04Avg Experience

Dashboard Views

HR Analytics Dashboard full dataset view

01 — Workforce & Attrition Overview

Overview of employee KPIs, department attrition, salary slabs, job satisfaction, age distribution, gender and experience.
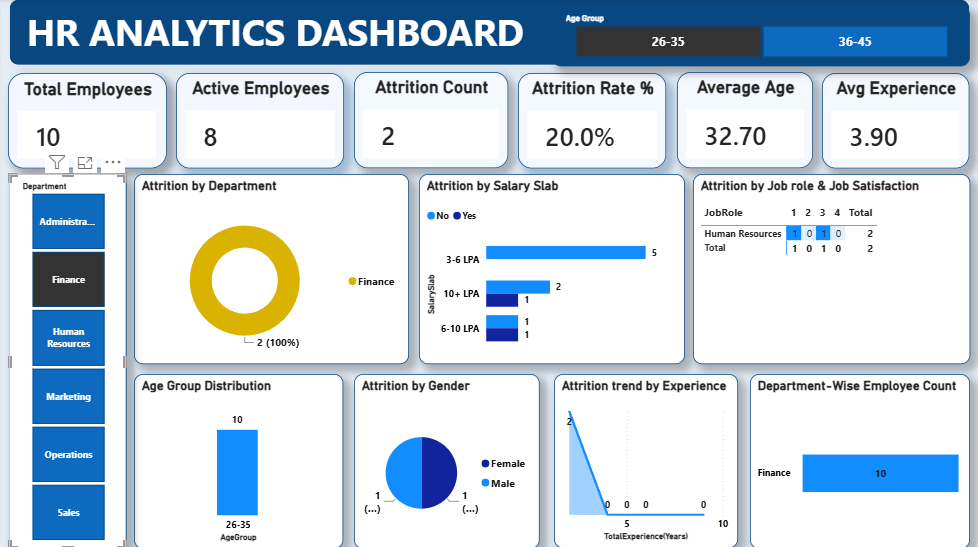
HR Analytics Dashboard filtered view

02 — Filtered HR Analysis

Filtered dashboard view showing how the same report can focus on a selected department or employee segment.

Key Insights

  • Overall attrition rate is 16.3%.
  • The 6–10 LPA salary slab has the highest visible attrition volume.
  • The 26–35 age group is the largest visible employee segment.
  • Administration has the highest visible department-level attrition share.
  • Male employees represent the larger share of the displayed attrition split.
  • Job role and job satisfaction provide useful indicators for retention analysis.

Future Scope

  • Add monthly and yearly attrition trend analysis.
  • Integrate employee satisfaction survey data.
  • Build predictive attrition analysis using Python or machine learning.
  • Add department and job-role drill-through pages.
  • Track the impact of employee retention initiatives.
← Back to Data Analytics Projects