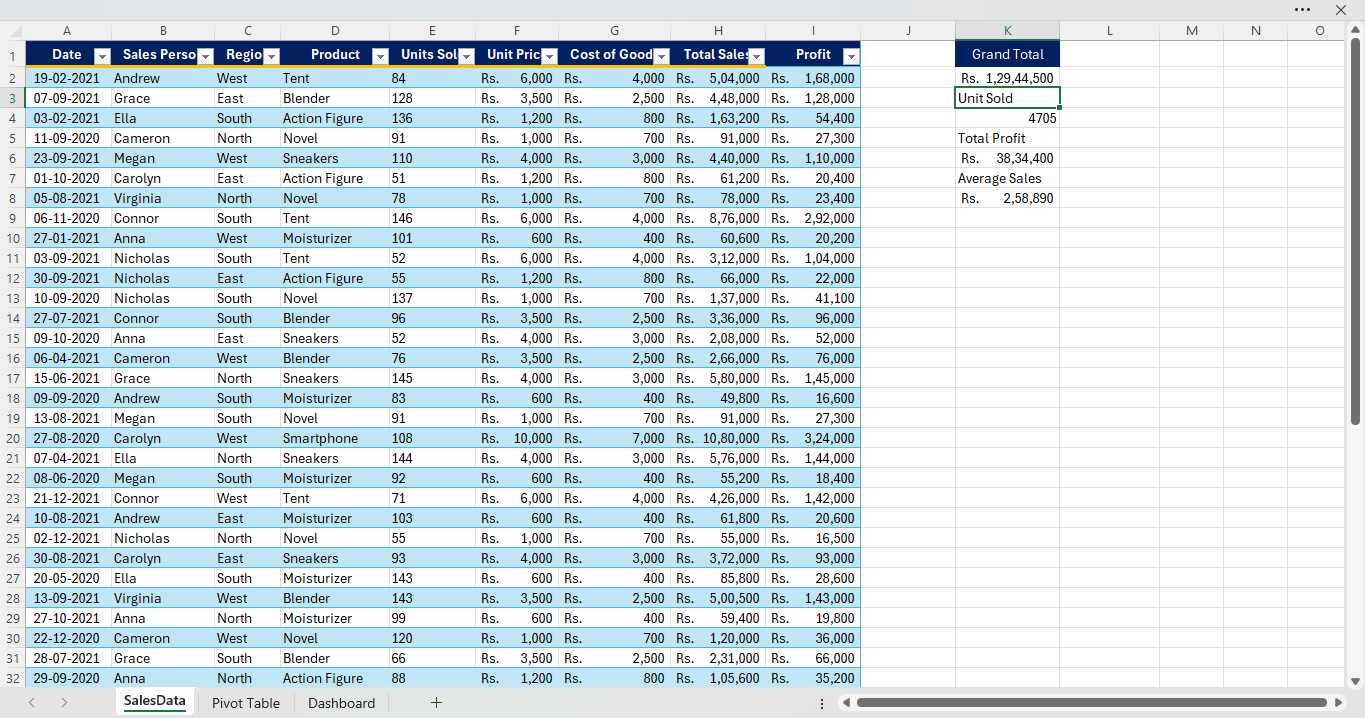
01 — Sales Data
The first worksheet contains 51 sales records with Date, Sales Person, Region, Product, Units Sold, Unit Price, Cost of Goods, Total Sales and Profit.
DATA ANALYTICS PROJECT 04
Interactive Microsoft Excel dashboard built to analyze sales performance, profitability, product performance, regional sales and salesperson performance.
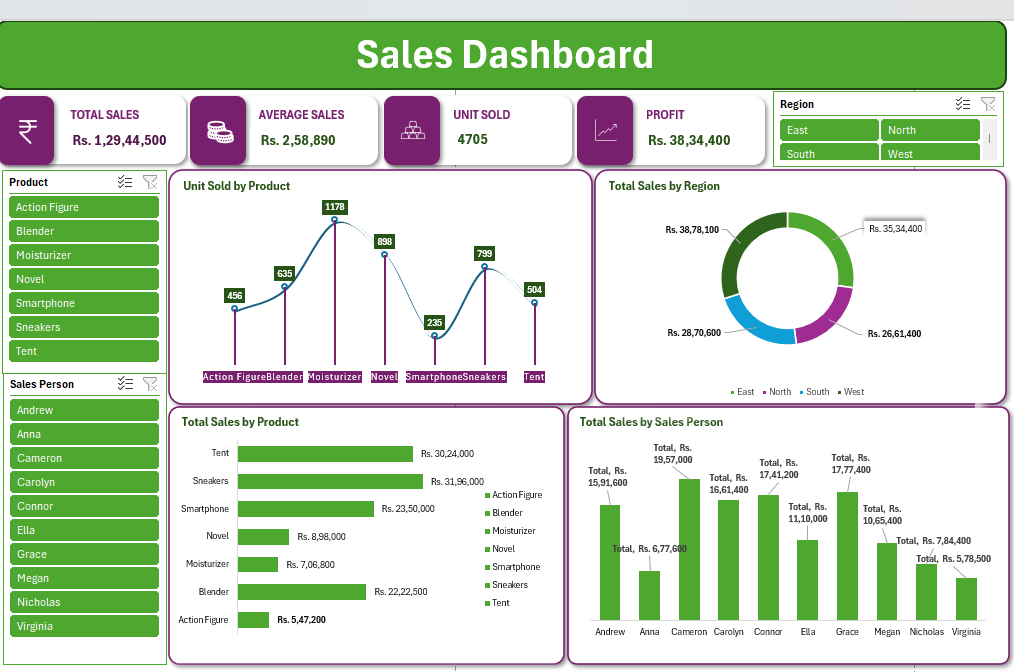
This project analyzes a 51-record sales dataset and converts the raw records into an interactive Excel dashboard. The workbook is organized into three stages: raw sales data, PivotTable-based analysis, and the final dashboard.
The analysis focuses on sales volume, revenue, profitability, product performance, regional performance and salesperson performance.
The first worksheet contains 51 sales records with Date, Sales Person, Region, Product, Units Sold, Unit Price, Cost of Goods, Total Sales and Profit.
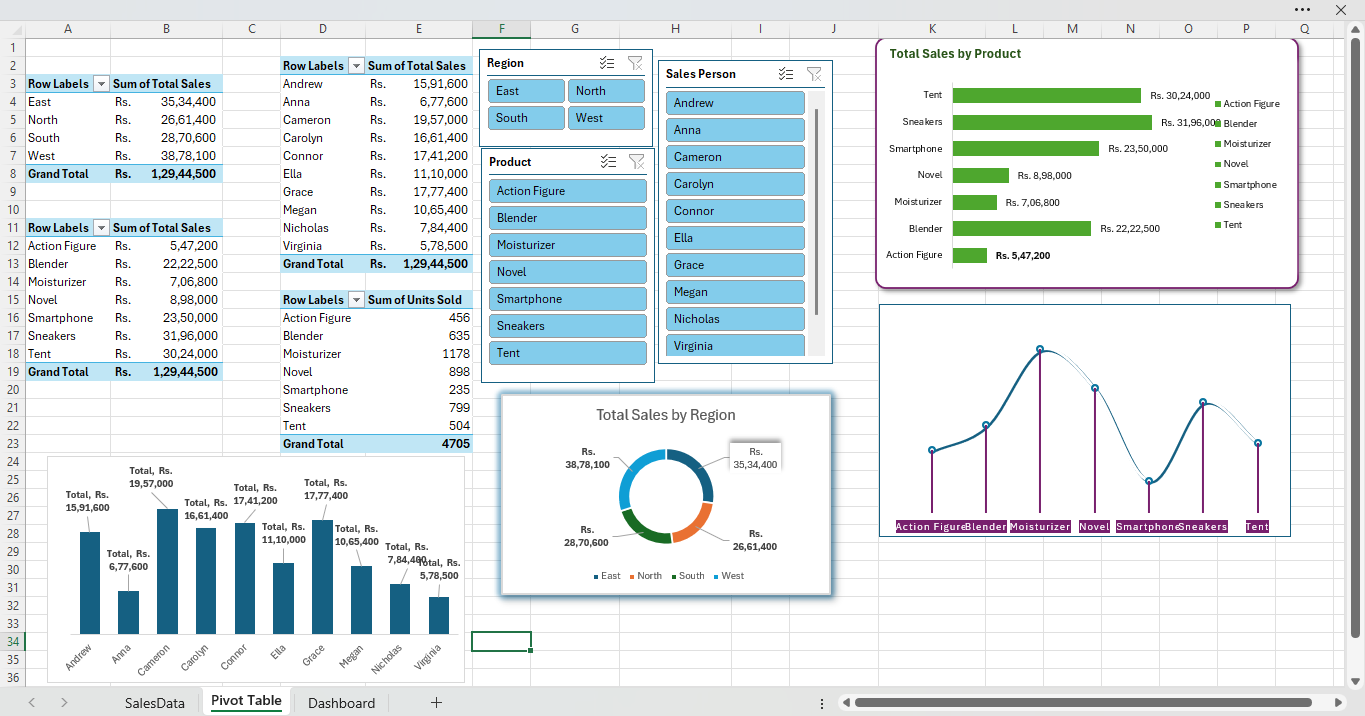
PivotTables summarize sales by region, product and salesperson, while slicers provide interactive filtering for Region, Product and Sales Person.
The final dashboard combines KPI cards, product analysis, regional sales, units sold and salesperson performance into an interactive view.
The dashboard enables quick comparison of products, regions and salespeople. From the displayed analysis, West has the highest regional sales, while Sneakers has the highest product sales among the displayed categories.
Created a structured Excel analytics workflow that transforms raw sales records into an interactive dashboard for faster performance monitoring and business analysis.
View GitHub ↗